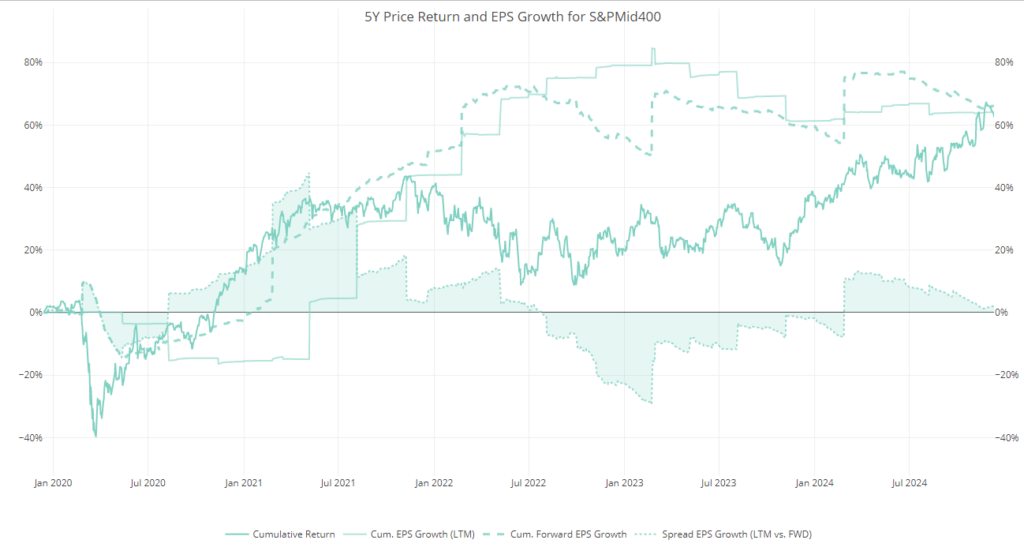
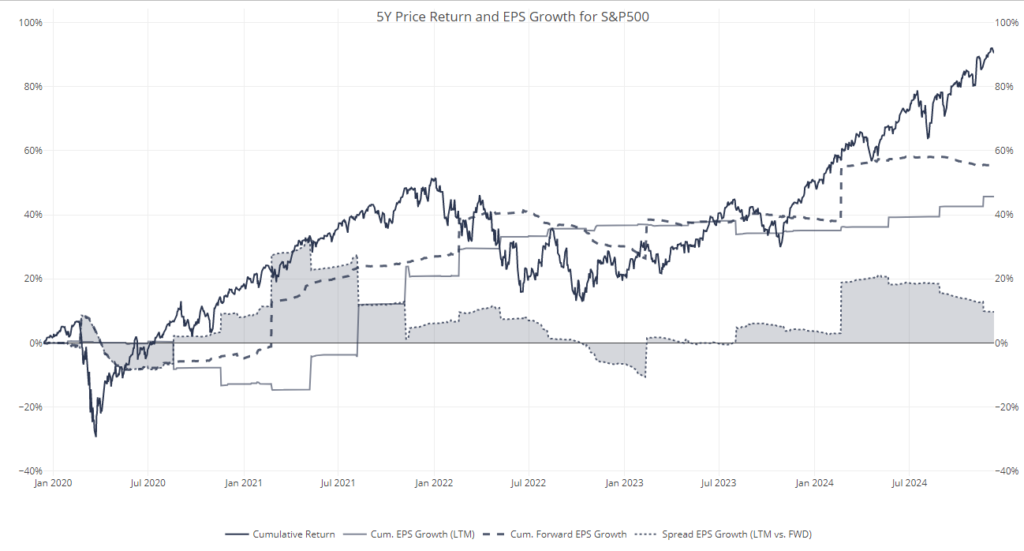
The graphics compare the Price Return of the S&P MidCap 400 Index and the S&P 500 Index over the past five years. Additionally, they showcase the cumulative growth of EPS (LTM) and forward EPS, as well as the spread between these growth rates, providing insights into the performance and earnings dynamics of mid-cap versus large-cap companies during this period.
5Y Price Return and EPS Growth for S&P 500 Index
5Y Price Return and EPS Growth for S&P MidCap 400 Index